Cambium Networks uses data – lots of data – to optimize product performance without increasing costs. For example, in the manufacturing process, we use automated processes to alert us deviations from norms and violations of tolerances to identify opportunities for improvements to product quality. At one level this is not particularly novel and what you would expect any manufacturer to be undertaking. The difference is the degree that Cambium Networks has taken the collection of data at the component level. This information helps us to contain production fallout and catch subtle variances across the thousands of components in each radio. This analysis is significant because subtle differences in equipment installed in harsh environments can cause service interruptions, downtime, and repair dispatches. As much as network operators need consistently reliable performance, we at Cambium Networks want it more.
In the PMP 450m with cnMedusa™ technology, performance of the Massive MU-MIMO antenna array is improved by the exact match of antenna columns relative to one another. Inevitably, the columns have slightly different performance due to the tolerances in components and manufacturing. Tight tolerances are maintained, but improvements can be made if the columns can be precisely matched relative to one another.
The only way to do that is by exact measurements. Given the component population, there are 1,036 individual measurements in each antenna column in the Massive MU-MIMO PMP 450m. That means that thousands of millions of data points need to be examined to pull out the useful information and yield actionable answers.
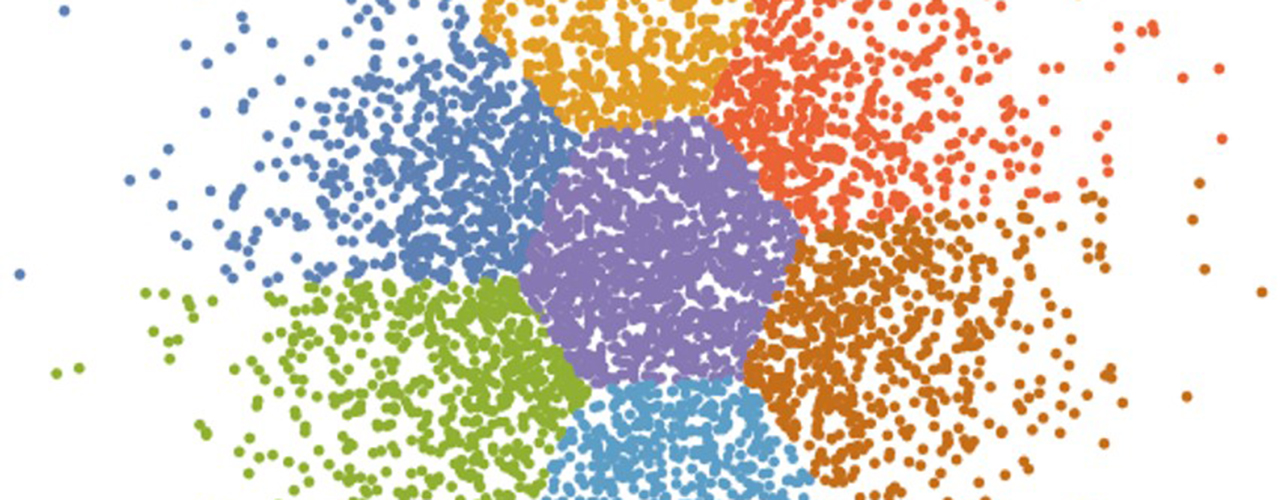
Artificial Intelligence (AI) provides a means to address this challenge. Cluster Analysis is where random data can be clustered into a predefined number of groups 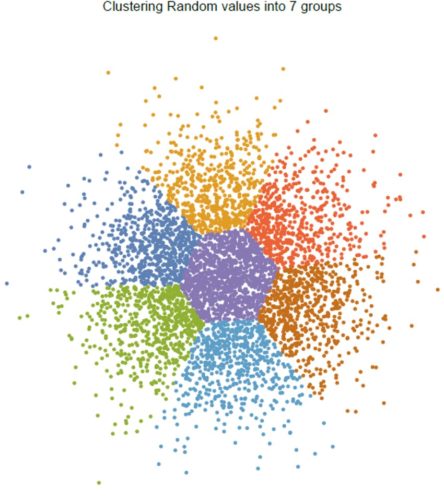 where each group contains a minimum difference from a mean value. The clustering process starts with a member in each of the groups and then moves data from one group to another until the set of differences in a group from a mean is minimized. For example, the diagram shows a random set of 5,000 points which have been clustered into 7 groups. This illustrates in a simple manner how the each of the groups have much smaller variance than the whole set of points.
In the specific case of the PMP 450m, the antenna measurement that is to be minimized involves two groups of 259 complex measurements of impedance. These measurements are presented to the Wolfram Mathematica FindClusters AI algorithm and the differences are minimized in a mean squared error sense. In our case we present the algorithm with 1,000 sets of column data and the mean differences from examples in each cluster are minimized. Our production team can then take the resulting clusters and make matched antennas from each group of columns. In addition to the obvious performance improvement benefit, this process also reduces the cost of antennas since there are fewer rejects from each batch.
Our key objective is to use available tools to deliver a reliable product. Our teams apply AI when it makes sense rapidly analyze massive amounts of data. These tools help us precisely measure deficiencies, understand issues, try solutions, and confirm the effects of changes.  Understanding is vital to producing a complex technology that performs exceptionally well.