It is well understood that the quality of an analytics engine is only as good as the data you feed it – a digital truism reminiscent of ‘garbage in, garbage out’. At Cambium Networks, we take this axiom to heart and redefine it as ‘precision in, excellence out’. This is the foundational principle we used to build our cnMaestro™ X Assurance feature set. While large enterprises may have custom-designed solutions to automate management, Cambium Networks brings this capability set to mid-market businesses and MSPs at a very affordable price point.
Within the Cambium ONE Network for Enterprise architecture, cnMaestro plays the crucial role as the single source of truth for all network configurations, and secondly, it acts as the unified console through which the administrator monitors and assures the network health and user experience. Let me explain how we built the X Assurance feature and showcase how it simplifies the lives of our customers.
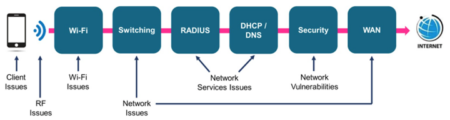
Our Enterprise Wi-Fi 6 and later Access Points (APs) have been instrumented at a very deep level in the radio and ethernet layers to capture every single transaction that happens between a wireless client and the various services in the network – like the DHCP, DNS, RADIUS, Captive Portal, etc. Why did we do that?

For most network users, “Wi-Fi is the internet”. But administrators know that is not the case – there are several points of failure between the Client and the internet as illustrated above. This means that without a deep understanding of the client’s interaction with each of these services, it will be impossible to pinpoint a failure or deviation from expectations in each step. So, we committed to an unparalleled depth of instrumentation in our APs to not only ensure precise, high-fidelity data collection, but make it the bedrock upon which we craft exceptional analytics, and reliable diagnostics to the IT administrator while assuring predictable performance to the users.
In cnMaestro X Assurance, we organize our Analytics at a Site level – to match with a natural geographic grouping of devices that are collocated. An administrator for a large account managing several managed services (MDUs, hotels), or a large, distributed enterprise or retail network is also presented with a consolidated view to see the performance of all their sites so that they can quickly jump to problematic sites for deeper analysis. At each site dashboard, a quick summary of the site-level failure rate and performance of each phase in the client connectivity is also presented.
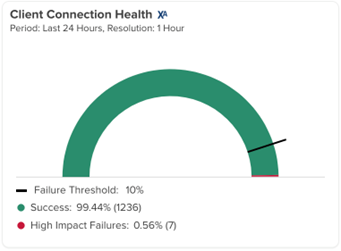


Color coding clearly indicates which phase is deviating from expectations, so that the administrator can quickly drill down straight into the network service. In the 2nd example above, DHCP service is at 13.4% failure, well above acceptable levels, and hence a red color is used to highlight it.
Many more details are available on the Site Analytics page. These are also color-coded to easily follow the track to identify abnormalities quickly. Let me demonstrate the depth of our drill-down capability. At the highest level, the system offers a flexible time series (1 hour, 24 hours, 7 days) visualization of all failures that occurred while clients connected.
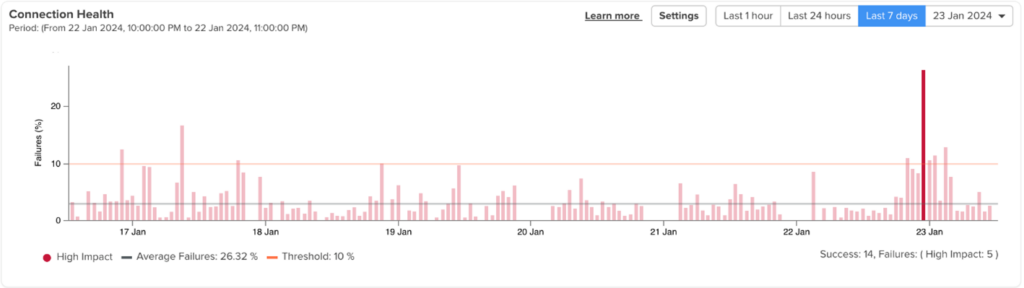
Along with this data, the system displays the top failure types, impacted device types, and which APs observed these failures. You can select any hour from the past 7 days to drill down. We offer a waterfall chart that clearly shows which phase contributed to the failures in each time window. In this example below, this time window corresponds to the 22:00 hour on 22 Jan selected above.
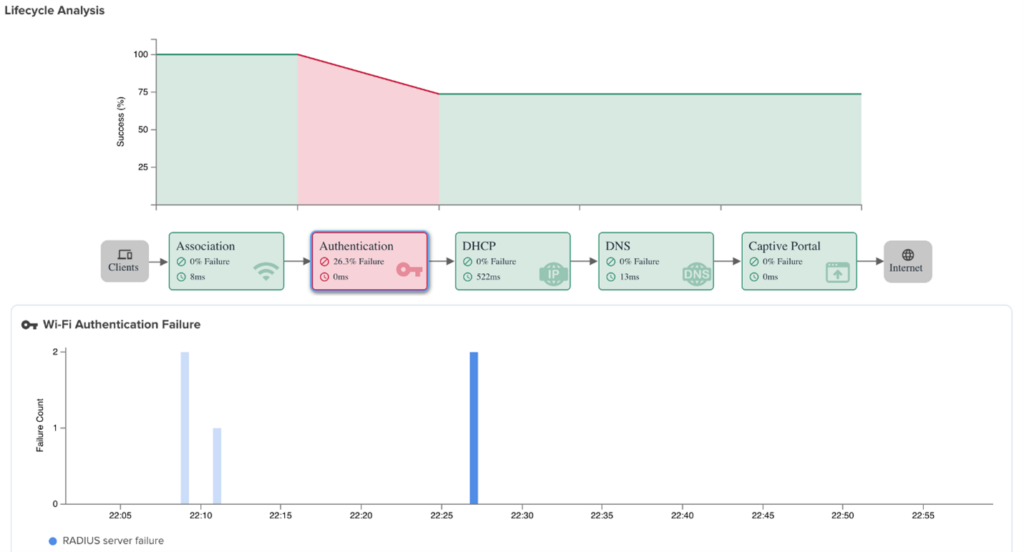
If you prefer, you can now drill down further to a 1-minute interval within that one hour – in this example above, it is 22h:27m. At this point, we give you the exact list of failure events reported at this site in that minute across all clients. So, events from any 1-minute window within the last seven days are easily available for drill-down exploration. When you open a specific client event, it gives you details and a summary of what happened, why it happened, and what can be done to remedy it. Here is an example of such a failure:
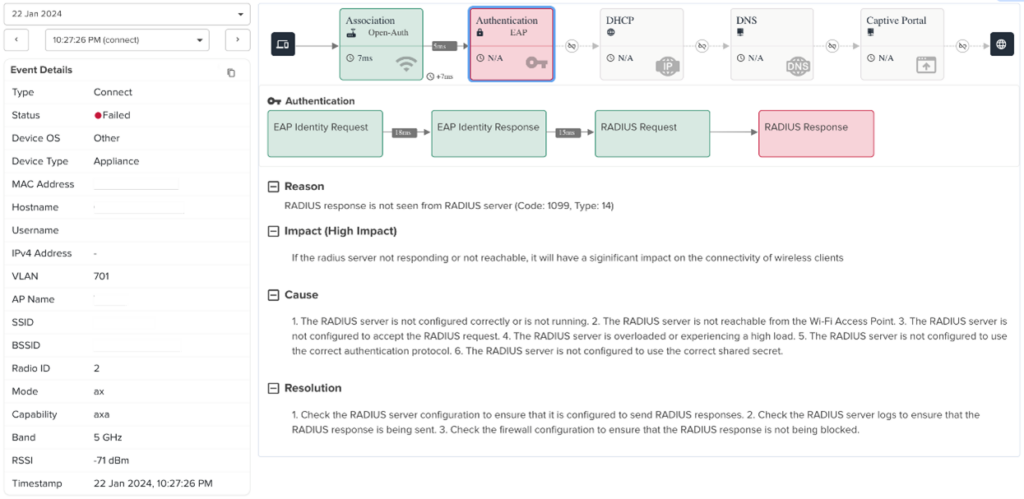
The depth of our instrumentation in the APs allows us to identify the root cause for more than 100 cases. Best of all, there is no need to ask your users for reproduction or to send your technicians onsite to get a packet capture. The system automatically identifies the root cause of each failure that occurred in the past seven days with high confidence. Granted you will see similar or more sophisticated solutions from other larger vendors – but they are targeted at large enterprise customers with deep pockets. Cambium Networks brings this capability set to mid-market businesses and MSPs at a very affordable price point. And we are working on several more exciting features on the Assurance roadmap.
Here are some real-world examples:
- “Some users periodically couldn’t get internet access when connecting to a guest portal. A quick look at the X Assurance analytics showed a DHCP failure on one of the APs. This information lets us quickly find that the attached switch pruned the VLAN. Without X Assurance, we would have spent hours looking for other problems.”
- “Several users reported issues connecting to corporate Wi-Fi. The Analytics page indicated all reporting users were on corporate-issued Windows laptops. Explored the Wi-Fi driver version and found that it was several years old. Upgraded driver and connectivity stabilized.”
- “Several users reported issues around the same time connecting to corporate Wi-Fi. Assurance indicated a bump in failure in the authentication phase with RADIUS errors around the time of the issue. Exploring the Windows AAA server health indicated an issue with the NPS service that was restarted to resolve the issue. Took 5m to rule out Wi-Fi and isolate the issue to AAA infra.”
- “A unit in a newly deployed MDU reported that the Internet is not working. Assurance clearly indicated that the ePSK VLAN for the unit is missing in the AP serving the unit. Root caused in few minutes.”
- “At a school district, the Assurance feature was very useful in debugging DHCP issues, particularly for DHCPACK packets getting dropped somewhere before reaching AP. Took this information to the switching vendor to debug further from their side. In addition, Assurance was used to debug and diagnose RADIUS/EAPOL failures effectively.”
- “At a hotel in Malaysia, guests reported connectivity issues. Assurance pointed to Captive Portal failure, which helped isolate the issue to the RADIUS connectivity from the Captive Portal in less than 5 minutes.”
So far, I have been talking about connectivity failures. We also capture detailed disconnection events and provide analytics on that also – I will keep that as a topic for another blog post in the future.
Network users want uninterrupted digital experiences through the internet – whether at work, home, or leisure. We at Cambium understand that for the users, “Wi-Fi is the internet” and our goal is to help you assure them a supreme digital experience with our Cambium ONE Network for Enterprise. We also understand that small and medium businesses can achieve the benefits of automation that was previously only available to large enterprises. As an IT administrator or a Managed Service Provider, we provide you with the intuitive and powerful tools to keep your networks operating at the best possible service levels, with the least amount of effort and cost, so that you can scale your business fast.