We often talk about Wi-Fi in very binary terms, it’s “good” or “bad”. Our smart phones display four bars to indicate “good” or “bad” Wi-Fi. However, even four bars is not enough to describe a Wi-Fi network.
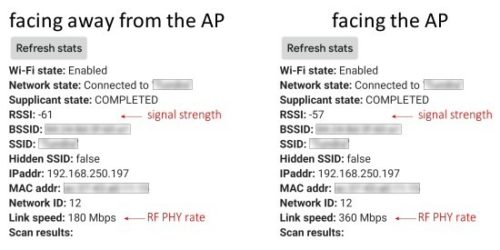
Wireless signals are not uniform within the space we want to cover. RF signals are reflected off mirrors and tile, and absorbed by drapery, furniture and the human body. Try this experiment: hold your phone very close to your body. Facing an AP in your home, monitor the RSSI signal level as reported by one of many Wi-Fi scanning apps. Then turn around, holding the phone close to your body. Did you notice the RSSI drop? Depending on the scanning tool, it may take 30s to see the difference, so be patient. On my Android phone, I can access raw RSSI data. Holding the phone close to my body results in a 4dB delta and dropped the RF PHY rate from 360 Mbps to 180 Mbps.
With all these variables, we need a range of signals to express the quality of the network. Many popular site survey tools graphically illustrate the signal strength by mapping the signal levels into a colored heat map. There is one flaw that I have often seen replicated when analyzing these heat maps. Very often, the tool will only display shades of green to represent all the colors from the good, the bad and the ugly. This makes it hard to identify the areas of suspect coverage. When everything is a shade of green, the colors run together. Kinda like our friend Simon’s choice of evening wear.
Many survey tools will include a method to set the color range to a user defined range. Let’s now discuss the best “range” to show the signal quality for a Wi-Fi network.
To obtain the highest RF PHY rate and maximum bit density (QAM); a typical 802.11ac radio will require 35dB of signal-to-noise ratio (SNR). A lower SNR will cause the RF PHY rate and QAM to drop. Look again at the results from the simple test in my house. A drop of 4dB resulted in a 50% reduction in the RF PHY rate. To be fair, the 50% drop was more likely the result of dropping a MIMO stream when the phone was held close to my body. 802.11ac networks should be designed with a dynamic range about 15dB, or even 10dB if you can. If 35dB will result in the best performance, then 20dB SNR should be the lowest in the environment.
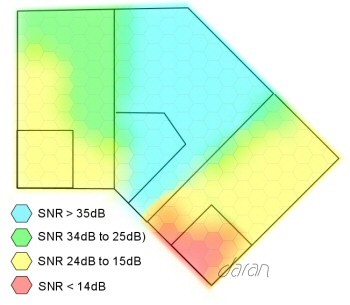
Lower than 20dB and the clients will have slow connections, higher than 35dB will not result better performance. I like to set the color range to 20dB, so that I can “see” where some clients may encounter problems and others will not. Note how the following illustration shows a 20dB SNR color range from great to bad. When viewing this heat map, we can clearly identify that wireless clients will have issues in the lower right corner. At this spot, a laptop may connect fine while a smart phone will not connect or have a slow connection. If designing to a 10dB range, we can say that Blue and Green are Great, Yellow is Ok to fair, and Red is bad.
Isn’t RSSI the standard way to view a RF site survey?
Thus far, we have used SNR to describe the wireless network. Some hotel brands use RSSI levels to establish the brand standard for Wi-Fi. Which one should we use? RSSI and SNR are mathematically related, in that [SNR = RSSI – RF background noise]. The reason we choose SNR is that the same range is used by the radio chipset to measure both the signal and the noise. So long as the two values, signal and noise, are measured using the same chipset, then SNR is a reliable indicator.
RSSI is the received signal strength indicator – but it is a relative, not absolute value. It is relative to whatever the chipset manufacturer chooses to use as the maximum value. That sounds bad. If RSSI is not absolute, then it should be meaningless. Fortunately, common Wi-Fi chipset vendors choose to express RSSI using a dBm scale.
While SNR is a better metric, RSSI can be used. Most site survey radios in a laptop and smart phone cannot measure RF noise. Without the RF noise measurement, all we have to use is RSSI. If your network test relies solely on RSSI measurements, I recommend conducting a few throughput tests at the edge of the expected coverage to validate that sufficient SNR is available for maximum data rates.
Background RF noise is the collective RF signal strength in the particular frequency we are measuring. RF noise can come from non-802.11 devices, or it can come from other 802.11 transmitters using the same frequency. If noise = signal level, then no communication can occur.
A typical enterprise network background noise will be about -90 dBm. In high density networks such as stadiums, hotel ballrooms, and education; the noise floor can rise to -80 dBm. A lightly used enterprise might have these values at the edge of the network: [(-60 RSSI) – (-90 noise) = 30 dB SNR]; whereas a high-density ballroom might have [(-60 RSSI) – (-80 noise) = 20 dB SNR]. Thus, it is vital to know the intended use of the space for Wi-Fi, the density of people and devices, and the types of devices that will connect.
Wow, that really went off the rails. We started out talking about four bars for Wi-Fi signal and ended up with math homework. Let’s just tell our friend Simon three things: let someone else pick your colors, don’t eat sushi at a petrol station, and design your network to 25dB SNR.